Brazil-US trade records | US Major Imports-Exports with Brazil
Explore Brazil US trade with detailed insights into US imports from Brazil and US exports to Brazil covering key products and trade trends.
Brazil is the eighth-largest economy in the world, and its second-biggest trading partner is the United States. The US and Brazil have a rich history of trade activities between them, with their top imports and exports playing a huge role in the economic growth of both countries with Brazil and US trade or US Brazil trade. The US Brazil trade relationship plays a crucial role in the global economy, as the United States is one of Brazil major trading partners. This partnership involves a diverse exchange of goods and services, including agricultural products, machinery, and energy resources.
-
According to the latest US-Brazil trade data, the total trade between the US and Brazil accounted for $93.84 billion in 2024.
-
In 2024, the total US exports were made up of 2.3% of exports to Brazil and 1.2% of imports from Brazil.
-
According to the US shipment data and data on Brazil exports to US, the US imports from Brazil totaled $44.18 billion in 2024, while US exports to Brazil accounted for $49.66 billion based on US trade data and US-Brazil trade records.
-
The trade relationship between Brazil and the United States, or the US-Brazil bilateral trade, has been marked by significant growth and mutual benefit as per the export and import between Brazil and to USA.
As two of the largest economies in the Americas, these countries have a long history of trade cooperation that has resulted in a wide range of imports and exports. Let's take a closer look at the trade records between Brazil and the US, focusing on the major imports and exports between the two nations, how the US is among Brazil major trading partners, along with the US-Brazil trade statistics for 2024-25.
US-BRAZIL TRADE RELATIONS & Trade Agreements
The US and Brazil maintain deep and extensive political and economic links. One of the first nations to recognize Brazil was the United States in 1824, a year after Brazil gained its independence in 1822. The U.S.-Brazil trade partnership or Brazil and US trade relation is based on a shared commitment to sustainable economic development and prosperity; promoting international peace, security, and dedication to human rights; protecting the environment and biodiversity; upholding labor standards and workers' rights; deploying clean energy; and fostering strong defense, health, and security cooperation. The US and Brazil are part of major trade agreements such as the Agreement on Trade and Economic Cooperation (ATEC).
Top US Imports from Brazil: What does the US import from Brazil?
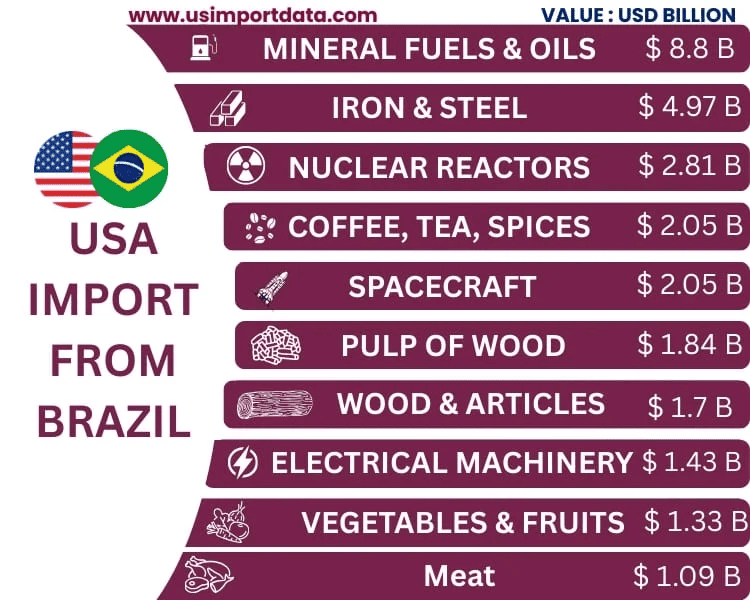
Mineral fuels and oils are the most imported commodity by the US from Brazil in 2024, worth $8.80 billion, followed by iron and steel and nuclear machinery, as per the data on Brazil exports to US. Now let's find out what does Brazil export to the US or what does the US import from Brazil in 2024-25. The top 10 imports by the US from Brazil in 2024, according to US Shipment data and US-Brazil trade activities, & brazil biggest export to USA, include:
1. Mineral Fuels and Oils (HS code 27): $8.80 billion
2. Iron and Steel (HS code 72): $4.97 billion
3. Nuclear reactors and machinery (HS code 84): $2.81 billion
4. Coffee, tea, and spices (HS code 09): $2.05 billion
5. Aircraft, spacecraft, and parts thereof (HS code 88): $2.05 billion
6. Pulp of wood (HS code 47): $1.84 billion
7. Wood and articles of wood (HS code 44): $1.70 billion
8. Electrical machinery and equipment (HS code 85): $1.43 billion
9. Preparations of vegetables, fruits, nuts, or parts of plants (HS code 20): $1.33 billion
10. Meat and edible meat offal (HS code 02): $1.09 billion
Top US Exports to Brazil | US Export Data for Export Trade with Brazil
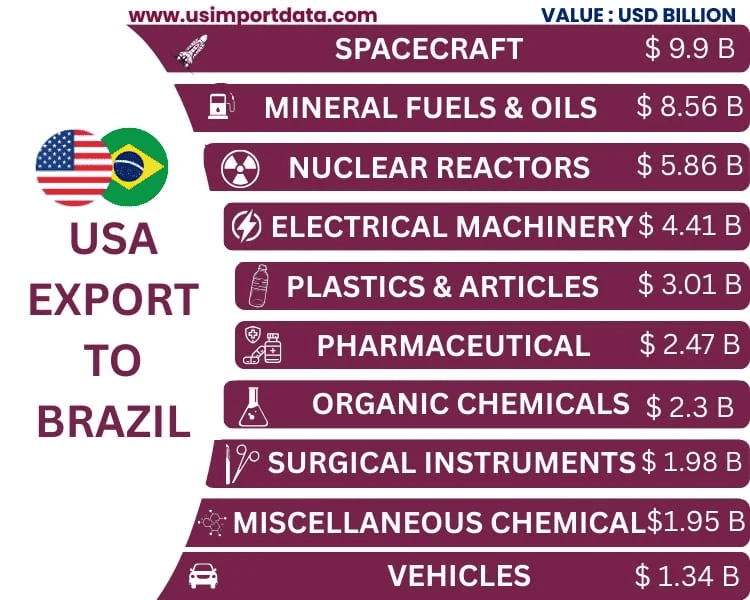
Aircraft, spacecraft, and parts thereof are the biggest US exports to Brazil in 2024, amounting to $9.99 billion, followed by mineral fuels and nuclear machinery. The top 10 goods exported by the US to Brazil, according to the US trade data and US-Brazil trade statistics for 2024, include:
1. Aircraft, spacecraft, and parts thereof (HS code 88): $9.99 billion
2. Mineral fuels and oils (HS code 27): $8.56 billion
3. Nuclear reactors and machinery (HS code 84): $5.86 billion
4. Electrical machinery and equipment (HS code 85): $4.41 billion
5. Plastics and articles thereof (HS code 39): $3.01 billion
6. Pharmaceutical products (HS code 30): $2.47 billion
7. Organic Chemicals (HS code 29): $2.30 billion
8. Optical, medical, or surgical instruments (HS code 90): $1.98 billion
9. Miscellaneous chemical products (HS code 38): $1.95 billion
10. Vehicles (HS code 87): $1.34 billion
US-Brazil Trade Records for Import-Export in the last 10 years
|
Year of Trade |
US Imports from Brazil ($) |
US Exports to Brazil ($) |
|
2014 |
$31.60 billion |
$42.42 billion |
|
2015 |
$28.52 billion |
$31.64 billion |
|
2016 |
$27.04 billion |
$30.19 billion |
|
2017 |
$30.56 billion |
$37.33 billion |
|
2018 |
$32.39 billion |
$39.40 billion |
|
2019 |
$32.16 billion |
$42.86 billion |
|
2020 |
$24.50 billion |
$34.59 billion |
|
2021 |
$32.82 billion |
$46.93 billion |
|
2022 |
$41.37 billion |
$53.57 billion |
|
2023 |
$40.99 billion |
$44.80 billion |
|
2024 |
$44.18 billion |
$49.66 billion |
Top US Importers Sourcing Goods from Brazil
|
US Importer Company |
Import Revenue to Brazil |
Active Import Shipments |
|
1. Cargill Inc. |
$4.5 billion |
2,300+ |
|
2. Bunge North America |
$3.8 billion |
1,900+ |
|
3. Archer Daniels Midland |
$3.2 billion |
1,700+ |
|
4. JBS USA |
$2.7 billion |
1,500+ |
|
5. Louis Dreyfus Company |
$2.1 billion |
1,200+ |
|
6. Chevron |
$1.9 billion |
900+ |
|
7. ExxonMobil |
$1.5 billion |
800+ |
|
8. Alcoa |
$1.2 billion |
700+ |
|
9. Tyson Foods |
$1 billion |
600+ |
|
10. Dow Chemical |
$900 million |
500+ |
Top US Exporters Making Export Shipments to Brazil
|
US Exporter Company |
Export Revenue from Brazil |
Active Export Shipments |
|
1. Boeing |
$4.2 billion |
1,800+ |
|
2. Caterpillar |
$3.6 billion |
1,500+ |
|
3. General Electric |
$3.1 billion |
1,400+ |
|
4. John Deere |
$2.8 billion |
1,200+ |
|
5. ExxonMobil |
$2.4 billion |
1,100+ |
|
6. 3M |
$2.0 billion |
900+ |
|
7. Dow Chemical |
$1.7 billion |
800+ |
|
8. Intel |
$1.4 billion |
700+ |
|
9. Microsoft |
$1.2 billion |
600+ |
|
10. Pfizer |
$1.0 billion |
500+ |
US Foreign Direct Investment Surges in Brazil's Key Sectors | US-Brazil Bilateral Trade
In Brazil, the United States continues to be the primary provider of foreign direct investment (FDI). U.S. foreign direct investment (FDI) increased by $38 billion (20 percent) to $228.8 billion in 2024, mostly due to higher investments in manufacturing (+$6.2 billion), real estate projects (+$5.5 billion), and information and telecommunications (+$16.8 billion). Nearly all of the major sectors of the Brazilian economy saw an increase in U.S. foreign direct investment (FDI), with the majority going into higher value-added categories like financial services ($59.7 billion, or 26% of total U.S. FDI in 2024), manufacturing ($55.1 billion, or 24%), telecommunications ($35.7 billion, or 16% of total FDI in 2024), automotive sales and maintenance ($22.2 billion, or 10%), and real estate ($8.4 billion, or 4%).
Frequently Asked Questions on US-Brazil Bilateral Trade Activities
1. How much beef does the USA import from Brazil?
The USA imported approximately 230,000 metric tons of beef from Brazil in 2024, valued at $1.5 billion.
2. What are the top 10 Brazil food commodities exported to the USA?
The top 10 Brazilian food exports to the USA in 2024, with a combined value of $7.8 billion, according to US import data include: soybeans
-
Coffee
-
Beef
-
Sugar
-
Ethanol
-
Miscellaneous Edible Preparations
-
Poultry
-
Edible fruit and nuts
-
Cocoa
-
Fish and seafood
3. How much sugar does Brazil export to the USA?
Brazil exported around 1.3 million metric tons of sugar to the USA in 2024, worth $550 million.
4. How much ethanol does the US export to Brazil?
The US exported about 450 million liters of ethanol to Brazil in 2024, valued at $230 million.
5. What are Brazil's top exporting companies to the US?
Brazil's top exporting companies to the US include Vale, Petrobras, JBS, Gerdau, and Embraer, with combined export values of over $12 billion.
6. How much is the value of Brazil's steel exports to the US?
Brazil's steel exports to the US in 2024 were valued at approximately $2.3 billion.
Conclusion
The trade relationship between Brazil and the United States is a vital component of both countries' economies. With a diverse range of imports and exports, these nations have established a strong trade partnership that benefits both sides. By analyzing the trade records between Brazil and the US, we can understand the significance of this relationship and the mutual advantages it offers. As both countries continue to collaborate and expand their trade ties, the future looks bright for their economic cooperation.
Also read about:-
14,600+ Active Spices Importers and Buyers in the USA
Search Live US Import Data by HS Code 01 to 99
What's Your Reaction?